

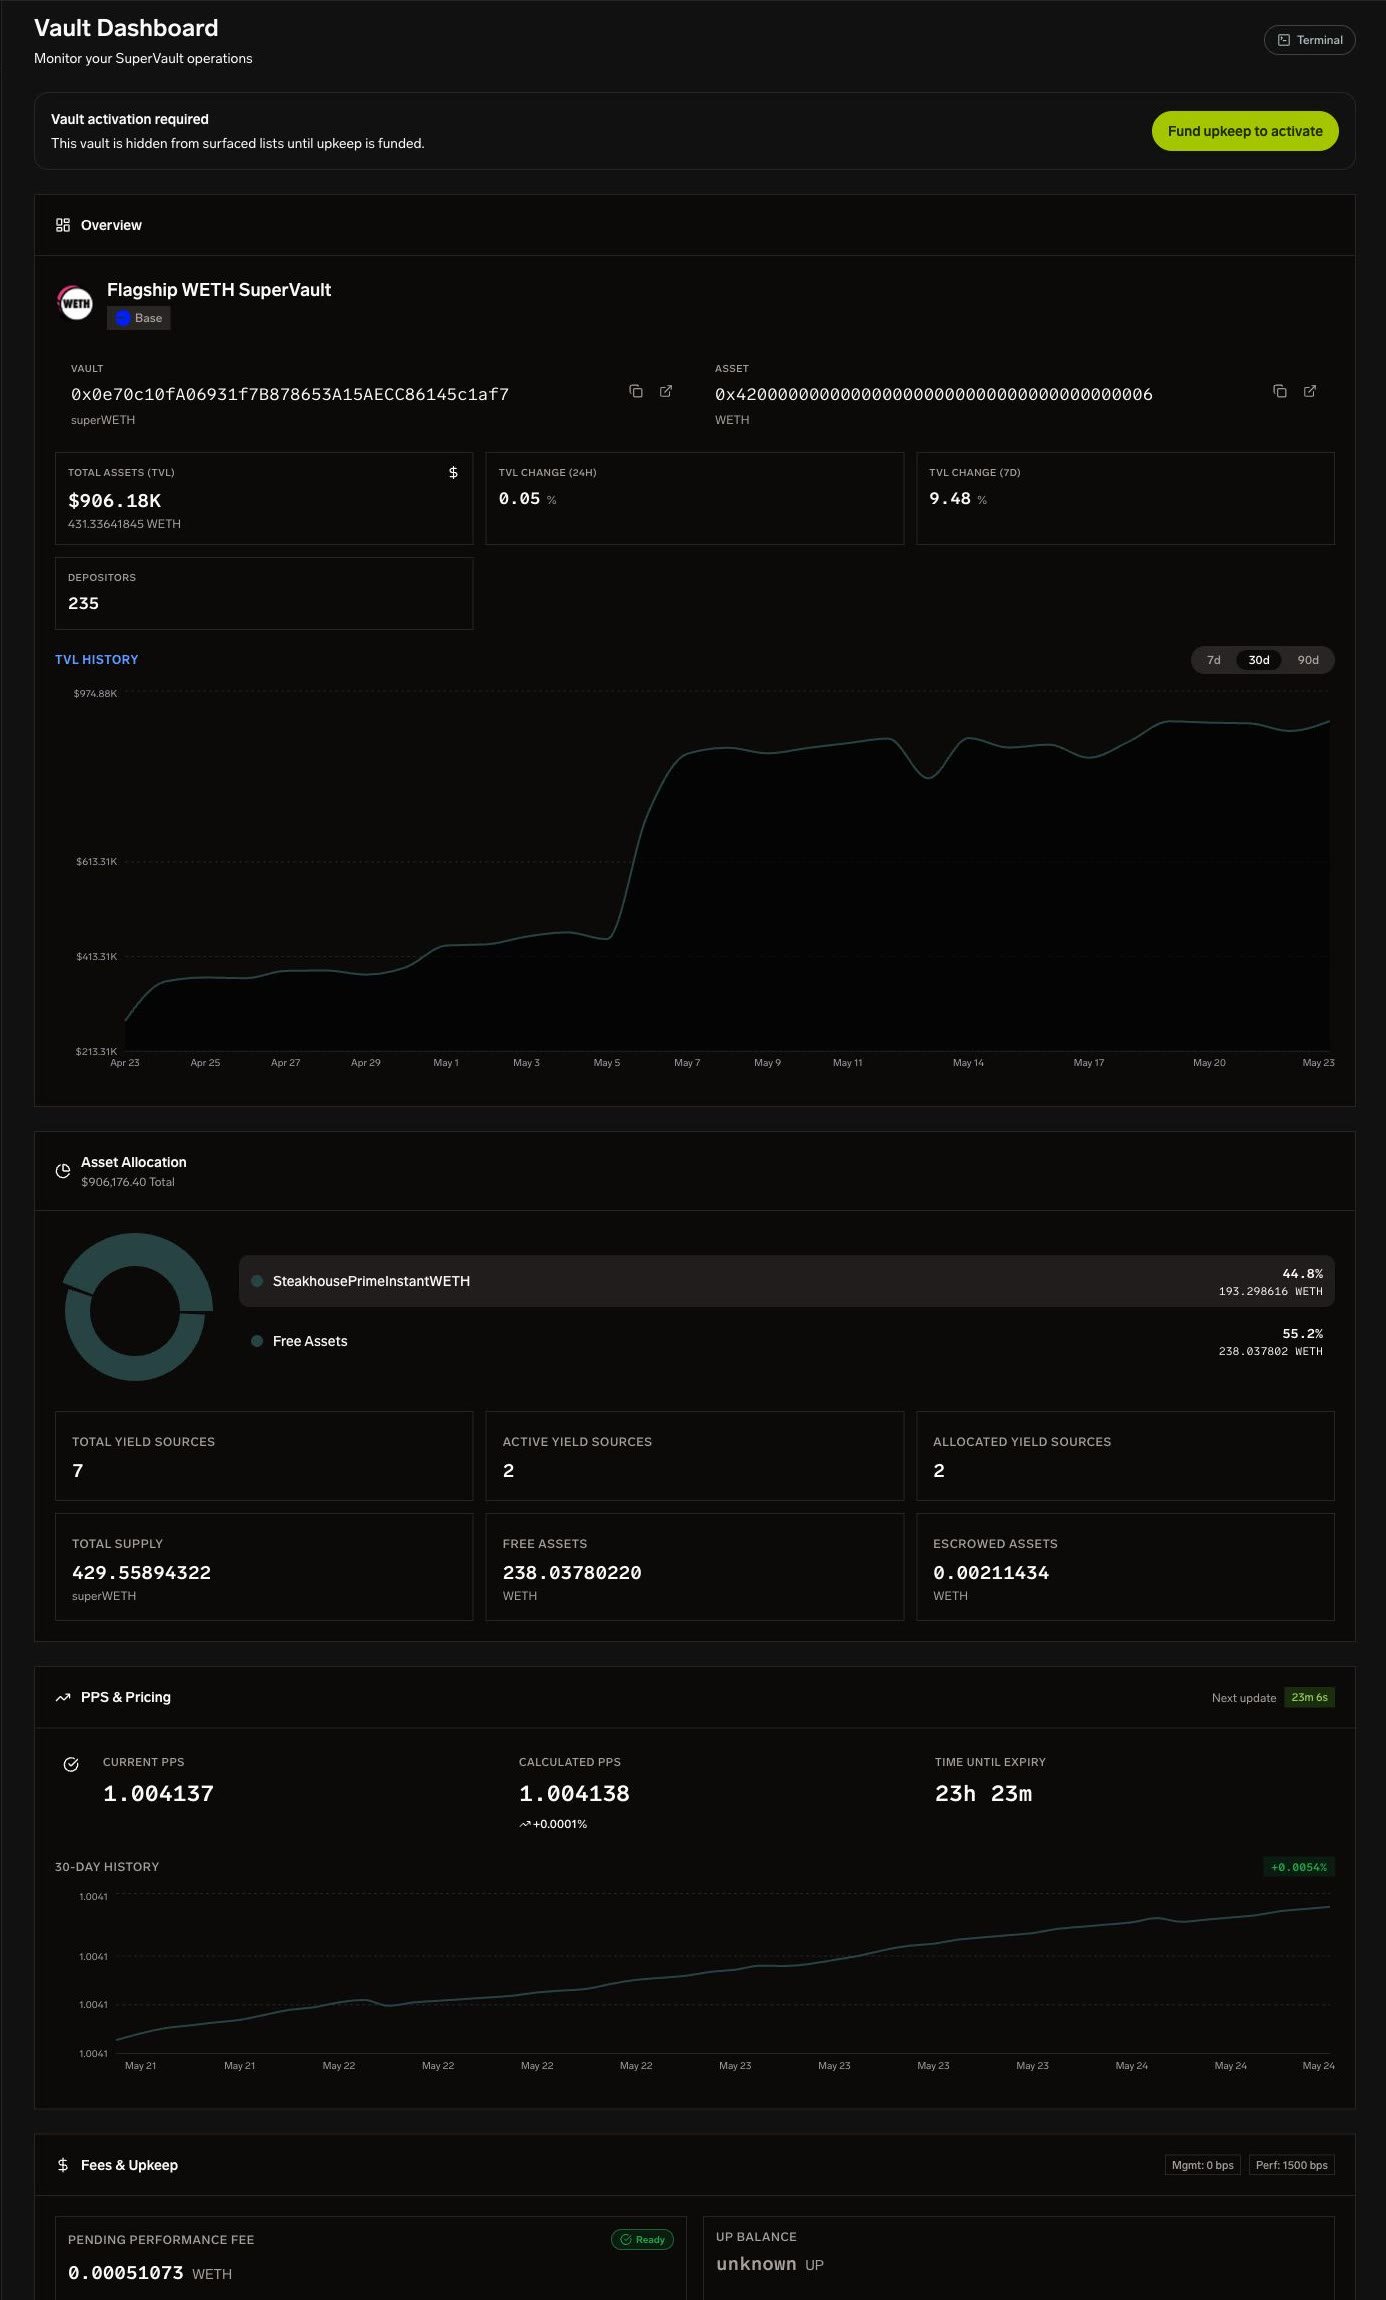
/supervaults/{chain_name}/{vaultAddress}. Nine sidebar sections cover every dimension of vault health: financial state, allocation composition, pricing, fee accrual, access control, performance history, risk metrics, depositor analytics, and operational throughput.
In Operate, select your chain and vault from the app controls. Public detail links use /supervaults/{chain_name}/{vaultAddress}. Financial data refreshes every 15 seconds from GET /api/v1/vaults/{chain_id}/{vault_address} plus Erebor analytics sub-endpoints.
Public Read-Only Route
Allocator-facing vault pages use the same dashboard data model without exposing manager controls. Use the public route to inspect vault state, tabs, settings context, strategy visibility, and merkle proof status exactly as a non-manager would see them. Manager-only actions such as settings updates, user changes, merkle generation, strategy editing, upkeep deposits, and pause flows stay in authenticated Operate pages.1. Overview
Top-level vault health metrics:2. Allocation
Pie chart showing current distribution of vault assets across yield sources. Each slice represents one whitelisted yield source with its allocation amount and percentage of total.3. PPS & Pricing
PPS history chart (time series fromanalytics/pps). Current, calculated, and HWM values displayed alongside staleness countdown with visual indicator. Min/max update intervals from SuperGovernor config.
4. Fees & Upkeep
Fee configuration data comes from the vault detail endpoint (
GET /api/v1/vaults/{chain_id}/{address}) in the fee_config field. Fee history is derived from vault analytics and audit log data.
5. Managers
Lists all wallet addresses with roles on this vault: primary manager, secondary managers, view-only users.6. Performance
- APY overview: current, 7-day, 30-day from
analytics/overview - APY time series chart with selectable periods
- TVL time series chart with selectable periods
- 24h and 7d TVL change
7. Risk
Risk data has a 2-minute stale time.
8. Users
Fromanalytics/users: total users, active users (24h/7d/30d), new users (24h/7d/30d), churned users, retention rate (7d/30d), average deposit size. Includes retention cohort table and top holders table.
9. Operations
Fromanalytics/operations: transaction count, deposit and withdrawal counts, gas costs (average and total), slippage (average and max), net flow. Deposit/withdraw volume chart and transaction history table.
Zap Terminal
The Zap Terminal opens as a modal overlay providing AI-powered vault analysis: a narrative covering performance, risk, yield sources, fees, and liquidity. Also includes an operator-focused social feed and WebSocket-based AI chat for vault Q&A.The Zap Terminal analysis endpoint (
GET /api/v1/vaults/{vaultAddress}/ai/analysis?chain_id={}) is operational and used by the Zap Terminal.